使用Streamlit快速构建人工智能前端界面
使用Streamlit快速构建人工智能前端界面
Streamlit是一个用于机器学习、数据可视化的 Python 框架,它能几行代码就构建出一个精美的在线 app 应用。相比于Gradio它有更强大的功能。

1.Streamlit的安装
# 安装
pip install streamlit
pip install streamlit-chat
# 测试
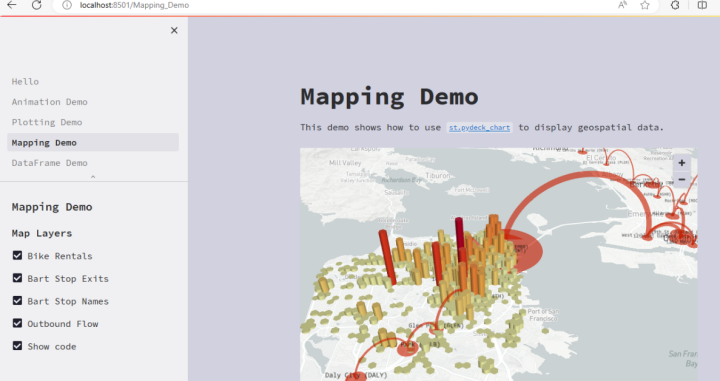
streamlit hello
  Local URL: http://localhost:8501
  Network URL: http://192.168.3.41:8501

  Ready to create your own Python apps super quickly?
  Head over to https://docs.streamlit.io

  May you create awesome apps!
会出现一些案例:
2.Streamlit基本语法
import streamlit as st
最常用的几种
- 标题st.title() : st.title("标题")
- 写入st.write(): st.write("Hello world ")
- 文本st.text():单行文本
- 多行文本框st.text_area():st.text_area("文本框",value=''key=None)
- 滑动条st.slider():st.slider(““)
- 按钮st.button():st.button(“按钮“)
- 输入文本st.text_input():st.text_input(“请求用户输入“)
- 单选框组件st.radio()
- st.image() : 图片
- st.audio() : 语音
- st.video() : 视频
- st.progress() : 显示进度
- st.spinner() : 显示执行状态
- st.error() : 显示错误信息
- st.warning : 显示警告信息
3.创建一个简单的app
实时读取数据并作图。
app.py
import streamlit as st
import pandas as pd
import numpy as np
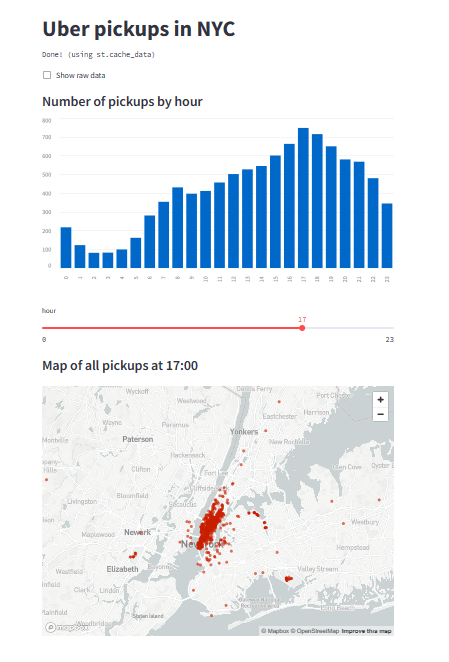
st.title('Uber pickups in NYC')
DATE_COLUMN = 'Date/Time'
DATA_URL = ('./data/uber-raw-data-sep14.csv')
# 增加缓存
@st.cache_data
# 下载数据函数
def load_data(nrows):
# 读取csv文件
data = pd.read_csv(DATA_URL, nrows=nrows)
# 将数据以panda的数据列的形式展示出来
data[DATE_COLUMN] = pd.to_datetime(data[DATE_COLUMN])
# 返回最终数据
return data
# 直接打印文本信息
data_load_state = st.text('正在下载')
# 下载一万条数据中的数据
data = load_data(10000)
# 最后输出文本显示
data_load_state.text("完成!(using st.cache_data)")
# 检查原始数据
if st.checkbox('Show raw data'):
st.subheader('Raw data')
st.write(data)
# 绘制直方图
# 添加一个子标题
st.subheader('Number of pickups by hour')
# 使用numpy生成一个直方图,按小时排列
hist_values = np.histogram(data[DATE_COLUMN].dt.hour, bins=24, range=(0, 24))[0]
# 使用Streamlit 的 st.bar_chart() 方法来绘制直方图
st.bar_chart(hist_values)
# 使用滑动块筛选结果
hour_to_filter = st.slider('hour', 0, 23, 17)
# 实时更新
filtered_data = data[data[DATE_COLUMN].dt.hour == hour_to_filter]
# 为地图添加一个副标题
st.subheader('Map of all pickups at %s:00' % hour_to_filter)
# 使用st.map()函数绘制数据
st.map(filtered_data)
运行
streamlit run app.py
其中uber-raw-data-sep14.csv数据集下载地址如下:
链接:https://pan.baidu.com/s/1vv_TP5o_jgwXJqsP3158QA 提取码:9527
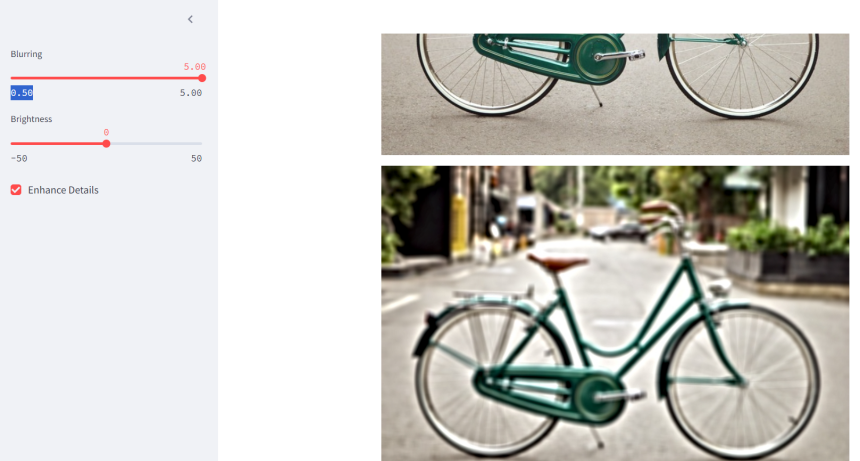
4.Streamlit+Opencv轻松构件web应用
import cv2
import streamlit as st
import numpy as np
from PIL import Image


def brighten_image(image, amount):
    img_bright = cv2.convertScaleAbs(image, beta=amount)
    return img_bright


def blur_image(image, amount):
    blur_img = cv2.GaussianBlur(image, (11, 11), amount)
    return blur_img


def enhance_details(img):
    hdr = cv2.detailEnhance(img, sigma_s=12, sigma_r=0.15)
    return hdr


def main_loop():
    st.title("OpenCV Demo App")
    st.subheader("This app allows you to play with Image filters!")
    st.text("We use OpenCV and Streamlit for this demo")
    blur_rate = st.sidebar.slider("Blurring", min_value=0.5, max_value=5.0)
    brightness_amount = st.sidebar.slider("Brightness", min_value=-50, max_value=50, value=0)
    apply_enhancement_filter = st.sidebar.checkbox('Enhance Details')
    image_file = st.file_uploader("Upload Your Image", type=['jpg', 'png', 'jpeg'])

    if not image_file:
        return None

    original_image = Image.open(image_file)
    original_image = np.array(original_image)
    processed_image = blur_image(original_image, blur_rate)
    processed_image = brighten_image(processed_image, brightness_amount)
    if apply_enhancement_filter:
        processed_image = enhance_details(processed_image)

    st.text("Original Image vs Processed Image")
    st.image([original_image, processed_image])


if __name__ == '__main__':
    main_loop()
运行效果: