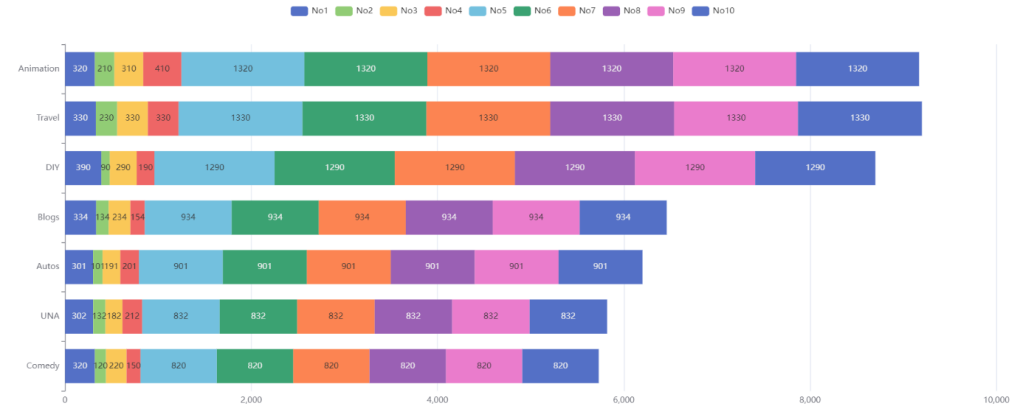
Echarts实现简单堆叠条形图效果
Echarts实现简单堆叠条形图效果
Echarts实现简单堆叠条形图效果
实现代码:
<!DOCTYPE html>
<html lang="en">
<head>
    <meta charset="UTF-8">
    <title>Title</title>
    <style>
        h1 {
            text-align: center;
        }
    </style>
</head>
<body>

<h1>Echarts实现堆叠条形图案例</h1>
<hr>

<div id="container" style="min-width:960px;height:600px">

</div>
<!--引入echarts库-->
<script src="https://lf3-cdn-tos.bytecdntp.com/cdn/expire-1-M/echarts/5.3.0/echarts.min.js"></script>

<script>

    let chartDom = document.getElementById('container');
    let myChart = echarts.init(chartDom);

    let option = {
        tooltip: {
            trigger: 'axis',
            axisPointer: {
                // Use axis to trigger tooltip
                type: 'shadow' // 'shadow' as default; can also be 'line' or 'shadow'
            }
        },
        legend: {},
        grid: {
            left: '3%',
            right: '4%',
            bottom: '3%',
            containLabel: true
        },
        xAxis: {
            type: 'value'
        },
        yAxis: {
            type: 'category',
            data: ['Comedy', 'UNA', 'Autos', 'Blogs', 'DIY', 'Travel', 'Animation']
        },
        series: [
            {
                name: 'No1',
                type: 'bar',
                stack: 'total',
                label: {
                    show: true
                },
                emphasis: {
                    focus: 'series'
                },
                data: [320, 302, 301, 334, 390, 330, 320]
            },
            {
                name: 'No2',
                type: 'bar',
                stack: 'total',
                label: {
                    show: true
                },
                emphasis: {
                    focus: 'series'
                },
                data: [120, 132, 101, 134, 90, 230, 210]
            },
            {
                name: 'No3',
                type: 'bar',
                stack: 'total',
                label: {
                    show: true
                },
                emphasis: {
                    focus: 'series'
                },
                data: [220, 182, 191, 234, 290, 330, 310]
            },
            {
                name: 'No4',
                type: 'bar',
                stack: 'total',
                label: {
                    show: true
                },
                emphasis: {
                    focus: 'series'
                },
                data: [150, 212, 201, 154, 190, 330, 410]
            },
            {
                name: 'No5',
                type: 'bar',
                stack: 'total',
                label: {
                    show: true
                },
                emphasis: {
                    focus: 'series'
                },
                data: [820, 832, 901, 934, 1290, 1330, 1320]
            },
            {
                name: 'No6',
                type: 'bar',
                stack: 'total',
                label: {
                    show: true
                },
                emphasis: {
                    focus: 'series'
                },
                data: [820, 832, 901, 934, 1290, 1330, 1320]
            },
            {
                name: 'No7',
                type: 'bar',
                stack: 'total',
                label: {
                    show: true
                },
                emphasis: {
                    focus: 'series'
                },
                data: [820, 832, 901, 934, 1290, 1330, 1320]
            },
            {
                name: 'No8',
                type: 'bar',
                stack: 'total',
                label: {
                    show: true
                },
                emphasis: {
                    focus: 'series'
                },
                data: [820, 832, 901, 934, 1290, 1330, 1320]
            },
            {
                name: 'No9',
                type: 'bar',
                stack: 'total',
                label: {
                    show: true
                },
                emphasis: {
                    focus: 'series'
                },
                data: [820, 832, 901, 934, 1290, 1330, 1320]
            },
            {
                name: 'No10',
                type: 'bar',
                stack: 'total',
                label: {
                    show: true
                },
                emphasis: {
                    focus: 'series'
                },
                data: [820, 832, 901, 934, 1290, 1330, 1320]
            }

        ]
    };

    //使用刚刚指定的配置项和数据项显示图表
    myChart.setOption(option);
</script>
</body>
</html>