SKLearn基础教程(三)
figure语法及操作
使用sklearn.cluester的KMeans类对航空公司客户数据进行聚类分析,把乘客分到不同的类别中: - 数据集:air_data.csv - 数据集大小:62052条不重复数据 - 原数据有40个属性,为了大家训练模型方便,本实验使用预处理后的标准化数据
1. figure语法及操作
figure(num=None, figsize=None, dpi=None, facecolor=None, edgecolor=None, frameon=True)
- num:图像编号或名称,数字为编号 ,字符串为名称
- figsize:指定figure的宽和高,单位为英寸;
- dpi参数指定绘图对象的分辨率,即每英寸多少个像素,缺省值为80 1英寸等于2.5cm,A4纸是 21*30cm的纸张
- facecolor:背景颜色
- edgecolor:边框颜色
- frameon:是否显示边框
figure实例。
import matplotlib.pyplot as plt
#创建自定义图像
fig=plt.figure(figsize=(4,3),facecolor='blue')
plt.show()
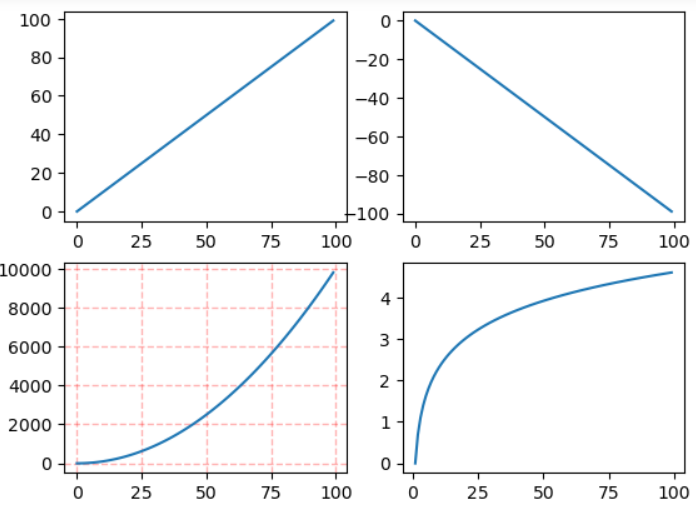
2.subplot创建单个子图
subplot语法:
subplot(nrows,ncols,sharex,sharey,subplot_kw,**fig_kw)
subplot可以规划figure划分为n个子图,但每条subplot命令只会创建一个子图 ,subplot(m,n,p)或subplot(mnp)
参考下面例子。
import numpy as np
import matplotlib.pyplot as plt

x = np.arange(0, 100)
# 作图1
plt.subplot(2, 2, 1)
plt.plot(x, x)
# 作图2
plt.subplot(2, 2, 2)
plt.plot(x, -x)
# 作图3
plt.subplot(2, 2, 3)
plt.plot(x, x ** 2)
plt.grid(color='r', linestyle='--', linewidth=1, alpha=0.3)
# 作图4
plt.subplot(2, 2, 4)
plt.plot(x, np.log(x))
plt.show()
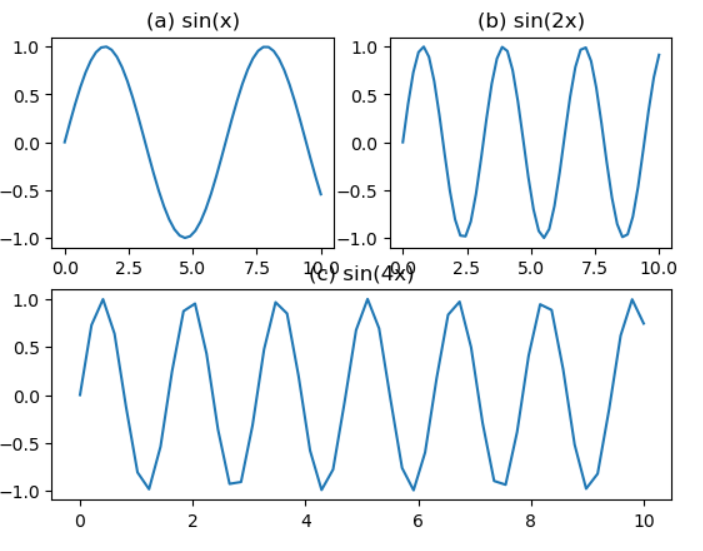
跨列效果。
import numpy as np
import matplotlib.pyplot as plt

plt.subplot(2, 2, 1)
x = np.linspace(0, 10)
y1 = np.sin(x)
plt.plot(x, y1)
plt.title('(a) sin(x)')

plt.subplot(2, 2, 2)
y2 = np.sin(2 * x)
plt.plot(x, y2)
plt.title('(b) sin(2x)')

plt.subplot(2, 2, (3, 4))
y3 = np.sin(4 * x)
plt.plot(x, y3)
plt.title('(c) sin(4x)')

plt.show()
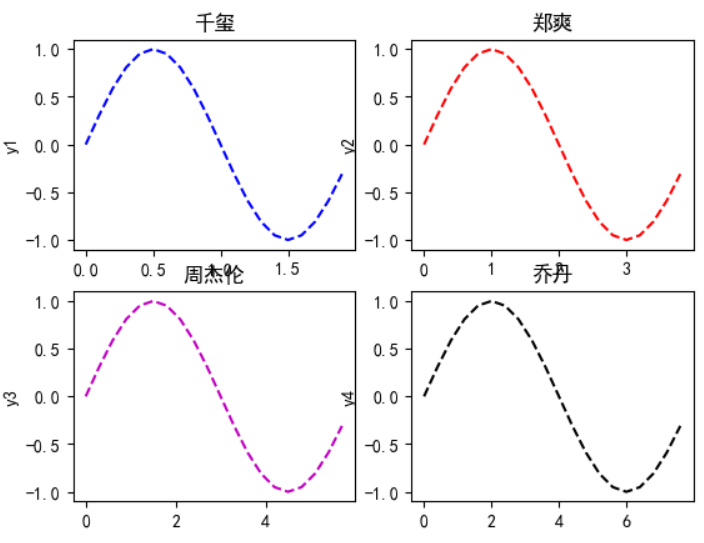
指定线形样式。
import numpy as np
import matplotlib.pyplot as plt

t = np.arange(0.0, 2.0, 0.1)
s = np.sin(t * np.pi)  # 2×np.pi就相当于2π
# 解决中文显示问题
plt.rcParams['font.sans-serif'] = ['SimHei']
plt.rcParams['axes.unicode_minus'] = False

plt.subplot(2, 2, 1)  # 要生成两行两列,这是第一个图plt.subplot('行','列','编号')
plt.plot(t, s, 'b--')
plt.title('千玺')
plt.ylabel('y1')
plt.subplot(2, 2, 2)  # 两行两列,这是第二个图
plt.plot(2 * t, s, 'r--')
plt.title('郑爽')
plt.ylabel('y2')
plt.subplot(2, 2, 3)  # 两行两列,这是第三个图
plt.plot(3 * t, s, 'm--')
plt.title('周杰伦')
plt.ylabel('y3')
plt.subplot(2, 2, 4)  # 两行两列,这是第四个图
plt.plot(4 * t, s, 'k--')
plt.title('乔丹')
plt.ylabel('y4')
plt.show()